Introduction
Frequently I make plots using the oce1 function imagep(), which at it’s core using the R-base function image(). R has several different graphics devices to choose from, and as each of them have different schemes for tasks such as anti-aliasing they can produce different results depending on the type of plot being created, and the type of file it gets written to. This can be especially apparent when using the filledContour type of plot. Frequently, I find that the default devices for making such plots in R produces undesirable artifacts, such as white lines in an image plot. The example below illustrates this effect using the adp data set:
library(oce)
data(adp)
imagep(adp[["v"]][, , 1], filledContour = TRUE)

In this post I’ll explore some options for making plots without such artifacts.
PDF devices
It is common for anti-alias effects like the white lines shown above to show up in figures created using the pdf() device. As PDF is essentially a vector graphics format, there is nothing to be done in R to correct the problem. Typically the anti-aliasing is handled by the PDF viewer, and is therefore not native to the file. It is often possible to disable anti-aliasing in many of the most popular viewers (e.g. I use Skim and Preview on OSX), but this has the unfortunate side effect of removing anti-aliasing from all aspects of the figure, including the fonts and axes labels, etc.
For this reason, when producing image plots, I almost always default to using a PNG device instead of a PDF. PNG works perfectly well with pdflatex, and has no artifacts due to image compression (such as in JPGs). The only issue remaining is how to ensure that the image plot itself does not suffer from anti-aliasing effects, while retaining the smoothing of fonts, lines, and points to make a beautiful plot.
PNG devices
For PNG devices, there are several options for the “type” of device, each of which will produce slightly different output. From the help page for png(), the arguments are:
png(filename = "Rplot%03d.png",
width = 480, height = 480, units = "px", pointsize = 12,
bg = "white", res = NA, ...,
type = c("cairo", "cairo-png", "Xlib", "quartz"), antialias)
where the type argument is described as:
type: character string, one of ‘"Xlib"’ or ‘"quartz"’ (some OS X
builds) or ‘"cairo"’. The latter will only be available if
the system was compiled with support for cairo - otherwise
‘"Xlib"’ will be used. The default is set by
‘getOption("bitmapType")’ - the ‘out of the box’ default is
‘"quartz"’ or ‘"cairo"’ where available, otherwise ‘"Xlib"’.
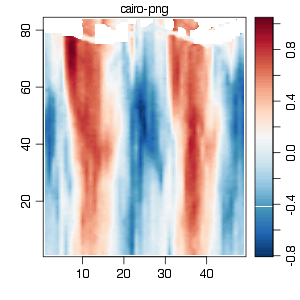
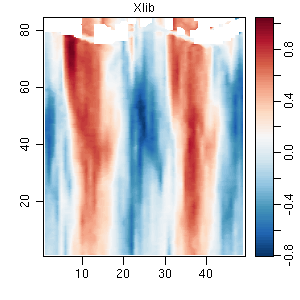
Let’s try some examples of each of the type options to see the difference.
types <- c("cairo", "cairo-png", "Xlib", "quartz")
for (itype in seq_along(types)) {
png(paste("typeExample-", types[itype], ".png", sep = ""), type = types[itype],
width = 300, height = 300)
imagep(adp[["v"]][, , 1], filledContour = TRUE, main = types[itype])
dev.off()
}
each of which produces the following:


Note that it is the default quartz type that produces the issues through anti-aliasing. This can be turned off by specifying antialias='none' (see the description of the antialias are from ?png for more details):
png("quartzNoAntialias.png", type = "quartz", antialias = "none")
imagep(adp[["v"]][, , 1], filledContour = TRUE, main = "quartz with antialias=none")
dev.off()
## pdf
## 2

This “fixes” the problem for the image plot, but leaves the fonts and axis lines un-antialiased.
Summary
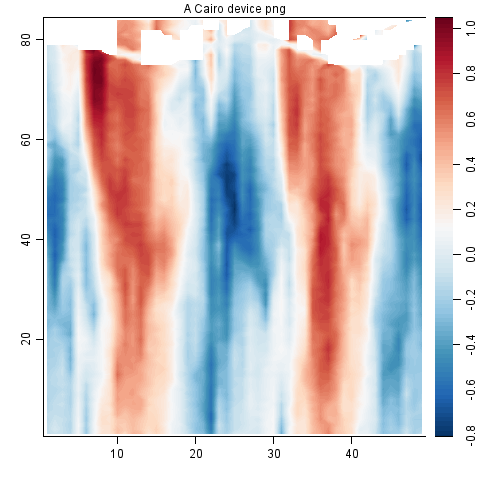
Based on the above, the best option for producing image-style plots without antialiasiaing artifacts is to use the type='cairo' option for the png device (note that by default Cairo devices use the Helvetica font family, whereas Quartz devices use Arial).
png("cairoDevice.png", type = "cairo", antialias = "none", family = "Arial")
imagep(adp[["v"]][, , 1], filledContour = TRUE, main = "A Cairo device png")
dev.off()
## pdf
## 2